The Importance of Collecting Deer Harvest Data
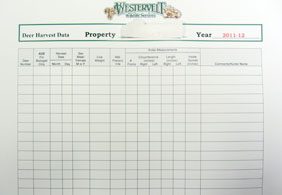
As the name implies, harvest data is taken from harvested animals. Standard data collected includes date, sex, age, weight, lactation, and antler measurements. It is essential to have a standardized procedure to ensure ALL information from EVERY deer is captured because this will be your database to use for monitoring current management strategies. Once compiled and analyzed, harvest data provides insight to herd health, age structure, sex ratio, and fawn production.
Don’t be too hasty in abandoning harvest restrictions or a management program based only on a couple years’ worth of data It can take several hunting seasons to produce a set of harvest data from which you can begin to identify trends. Initially smaller properties may have to pool data from adjoining properties until they have a dataset with sample sizes large enough to show statistical as well as biological trends. The data most commonly tracked from year to year is total deer harvested, weights, lactation rates, and antler measurements. Let’s go through the basics about each of these important areas.
The total number of deer harvested can be broken down by sex and age class. From this we can track historical harvest (number of bucks and does) and the age composition of the bucks and does harvested. You will need to keep in mind that several factors can affect deer harvest trends. For example, good mast years usually result in a lower number of deer harvested. This is not an indicator there are less deer, it means that deer observations were lower and thus harvest rates decreased. These factors should be noted from year to year so that rash decisions are not made based on a small window of information. This data will show us if we are meeting our harvest goals, if we need to better protect young bucks, or if we need to increase/maintain the doe harvest.

Deer weights are usually presented as averages by sex and age class. It is broken down by sex and age class because obviously bucks will weigh more than does and older deer will generally weigh more than younger deer. By comparing weights over time, you can assess herd health status. For example, if you begin to see a decreasing trend in weights, you may have more deer than the habitat can support and need to increase your doe harvest. Yearling buck weights are the best indicator of herd health, but few should be taken in a QDM program. Given the fact mature buck weights will fluctuate greatly during the season (rut), doe weights should be used as an indicator of herd health.
Lactation rates reflect the percentage of does that are “with milk”. If there is milk present, then that indicates that the doe successfully raised a fawn that year. Lactation data is not accurate for areas with early fawning dates (Florida) because fawns are usually weaned by hunting season. Reproductive rates vary among different age classes – yearling does usually have a lower reproductive rate than adult does. This creates the need to separate lactation rates for yearlings and adults. Declines in adult lactation rates can be an indicator of herd health or habitat problems. However, a high incidence of yearling lactation is an indicator of high herd productivity because that means some does are breeding as fawns.
Collecting age and antler measurement information is essential to monitoring the effectiveness of antler restrictions and management strategies. Common antler measurements taken are inside spread, beam length, basal circumferences, and number of points. However, intense deer management programs commonly measure and track the Boone & Crockett score from each buck harvested. Most serious deer hunters and managers talk in terms of Boone & Crockett scores. Boone & Crockett scores by age class can provide better insight to buck quality than standard antler measurements alone because the scores are calculated based on inside spread, beam length, tine length, and circumference measurements. This data can help you set buck harvest restrictions by giving you average antler characteristics by age class for your individual property. For example, if your management goal is to produce and harvest 130-class bucks, you will be able to see at what age (on average) bucks reach this score by having a database of harvest data. Taking photographs of each buck harvested is a good way to visually assess antler quality. You should separate the photos by age and over time you can develop a portfolio of management successes that will be a good selling feature for recruiting new club members.
Managers should look for unexplained shifts in age structure or sex ratio, decreases in age- and sex-specific body weights, decreases in lactation rates, and changes in antler quality by age class because these are signs that something is going on with the deer herd. When possible try to get data from adjoining or surrounding clubs. Explaining your goals may lead to the creation of cooperatives, which allows you to increase the size of your dataset to get a better idea of what is happening on a landscape level.

